
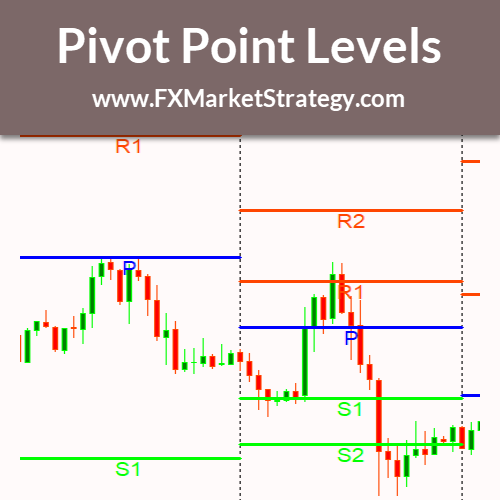
Pivot Point Levels
Indicator display classical pivot point support and resistance levels on chart with ability to change calculation time frame and number of previous historical bars.to show.
Indicator Features
- You can change calculation timeframe.
- You can change number of previous bars to calculate pivot for it.
- change support and resistance lines colors.
- Display five support and five resistance levels.
Pivot Point Formula
There is different equations to calculate pivot point levels, in this indicator we uses below formula
Pivot=(high+low+close)/3
Range=high-low
S1=(2*Pivot)-high
S2=Pivot-range
S3=Pivot-range*2
S4=Pivot-range*3
S5=Pivot-range*4
R1=(2*Pivot)-low
R2=Pivot+range
R3=Pivot+range*2
R4=Pivot+range*3
R5=Pivot+range*4
Pivot point levels indicator has some parameters so you can adjust it according to your needs, I'll explain it in details.

Pivot Calculation TimeFrame
timeframe to calculate pivot point levels, you can set it from 1 minute chart to monthly chart.
Historical Pivot Levels To Show
number of historical bars to draw pivot point levels.
Lines Title Size
text title size.
Pivot Line Color
pivot level line color
Pivot Line Width
pivot point level line width.
Pivot Line Style
pivot point line style (solid, dotted, dashed, ...)
Support Line Color
support levels line color
Support Line Width
support levels line width.
Support Line Style
support levels line style (solid, dotted, dashed, ...)
Resistance Line Color
resistance levels line color
Resistance Line Width
resistance levels line width.
Resistance Line Style
resistance levels line style (solid, dotted, dashed, ...)
Version 1.0 07.08.2019
- First initial version
Screenshots


